Methodology:
Data Cleaning: Explored and cleaned the raw Airbnb dataset in Excel. The dataset
contained data on listings including information like Hosts IDs, neighborhoods, room types,
availability…
Once the data was clean I exported it to Tableau for Data Analysis.
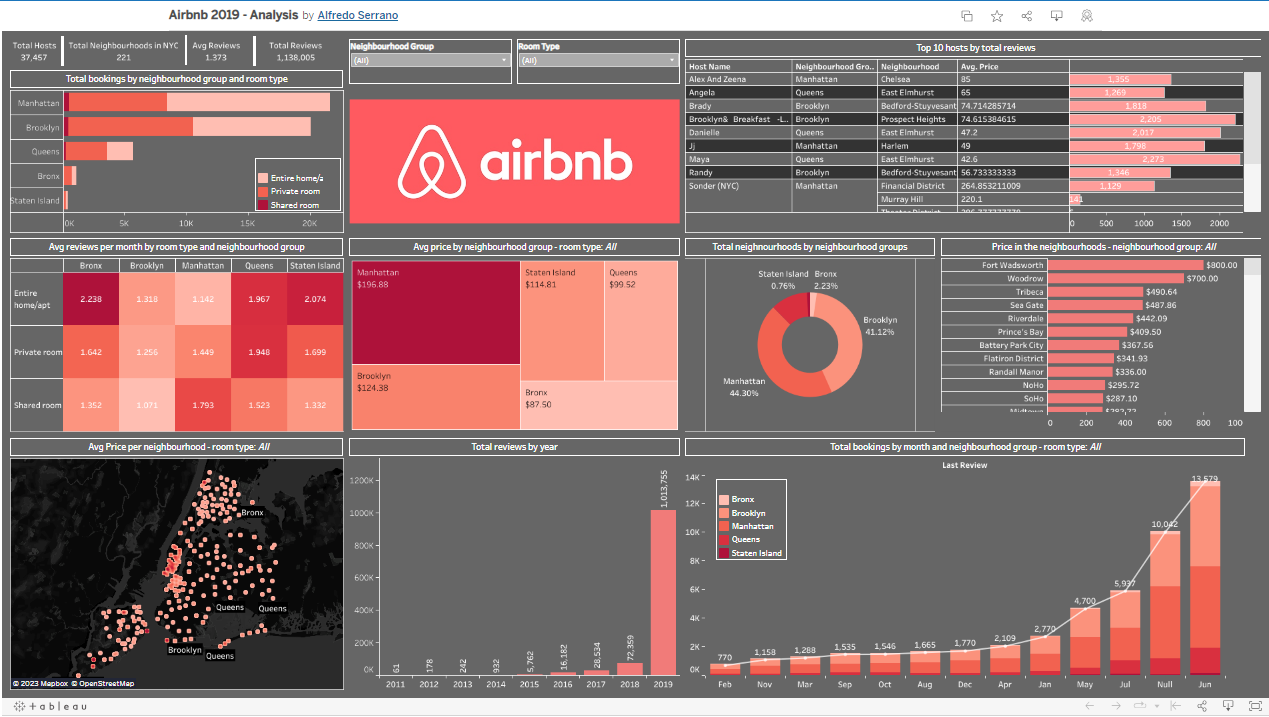
Exploratory Data Analysis: To provide a well-rounded understanding of the dataset, I
deployed the data into a Tableau notebook to gather insights through visuals like a map view of listings
by neighborhood, top hosts by number of listings, average price of listings by neighborhoods…
Interactive Reporting: Combined all visualizations, text, and data into a single
dashboard. Added filters to control views and segments and added titles, captions, and text for context.

Technical Tools/Software:
Excel: Used for data cleaning and preprocessing.
Pivot Tables: Used for summarizing, analyzing and exploring the dataset.
Tableau: Software used for reporting through the dashboard's interactivity and
functionality by
task automation and customization.
Conclusion:
Manhattan had the highest average price per night ($162) but Brooklyn is expanding with the
second highest price per night ($111).
Entire home/apartment listings gather higher reviews than private or shared rooms.
Some neighborhoods like Midtown Manhattan have lots of listings but lower reviews per month.
×
![]()


